

Fletcher Building has called New Zealand home since 1909.
Today we employ 12,000+ people in New Zealand, Australia, and the South Pacific.
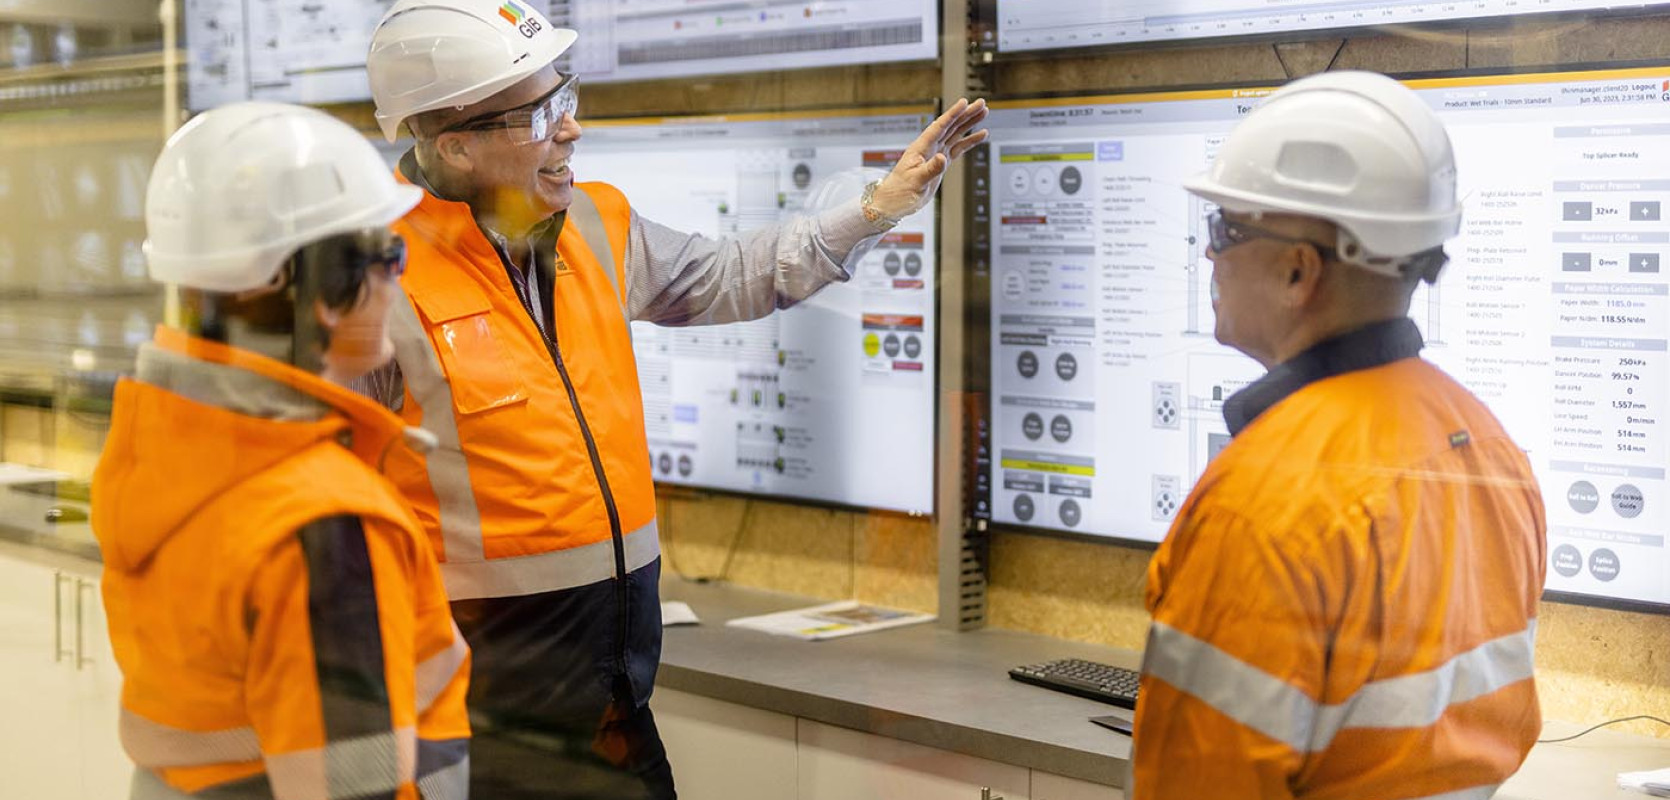
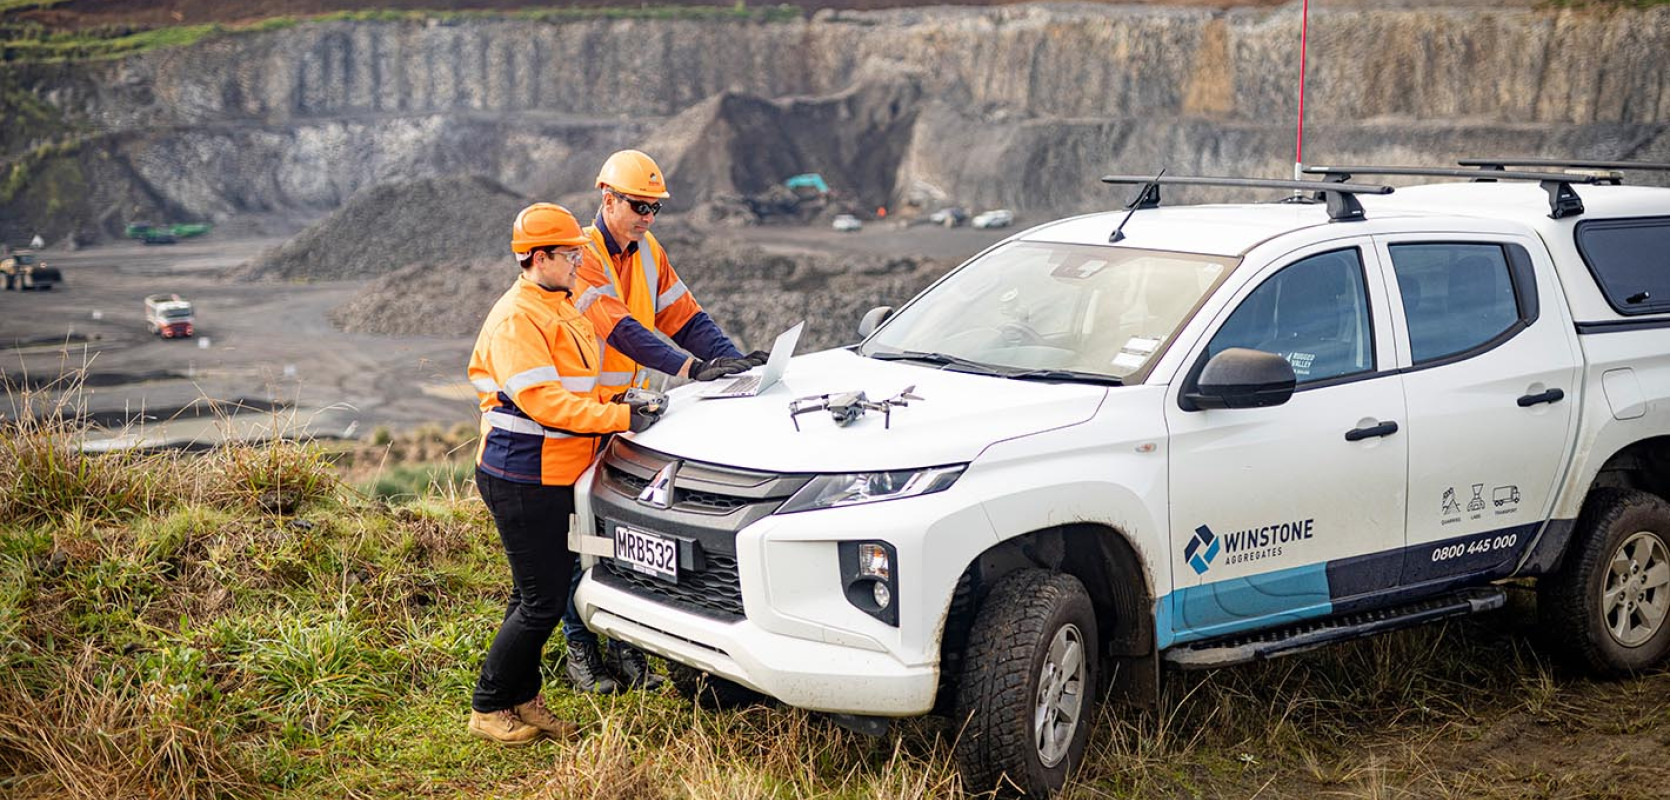
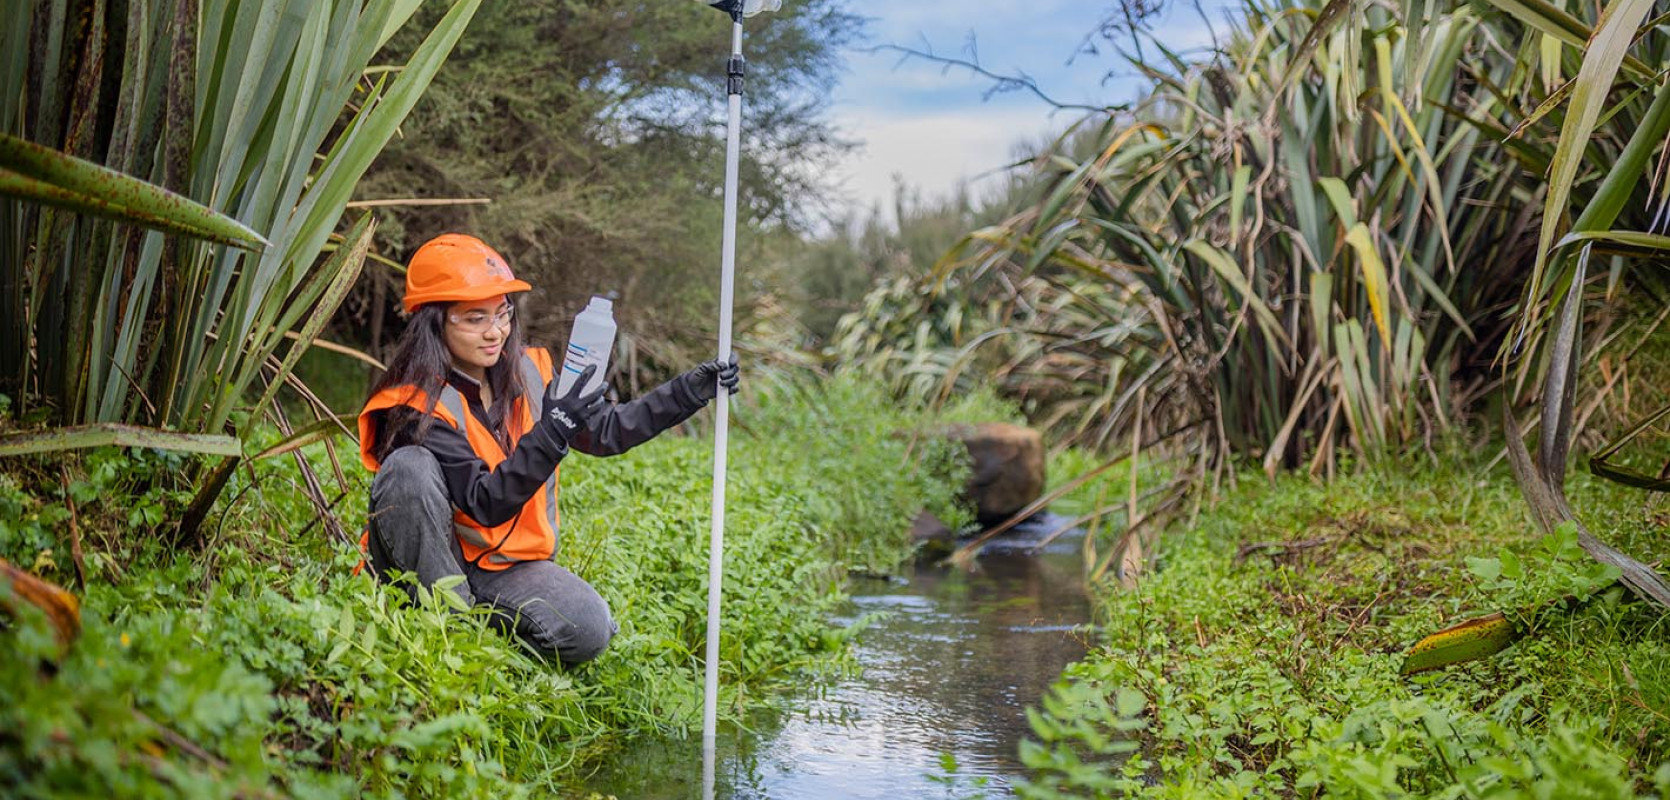
Our operations span manufacturing, distribution and retail, home building, and major construction and infrastructure projects.
Latest news
29 May 2026
FLETCHER BUILDING COMPLETES SALE OF CONSTRUCTION DIVISION
Read more
22 May 2026
CONSTRUCTION DIVESTMENT CONDITIONS SATISFIED
Read more
14 May 2026
FLETCHER BUILDING ANNOUNCES FIJI DIVESTMENT
Read more
8 May 2026
SALE OF LAMINEX CHELTENHAM PROPERTY
Read more
See all news and announcements
View all


